All projects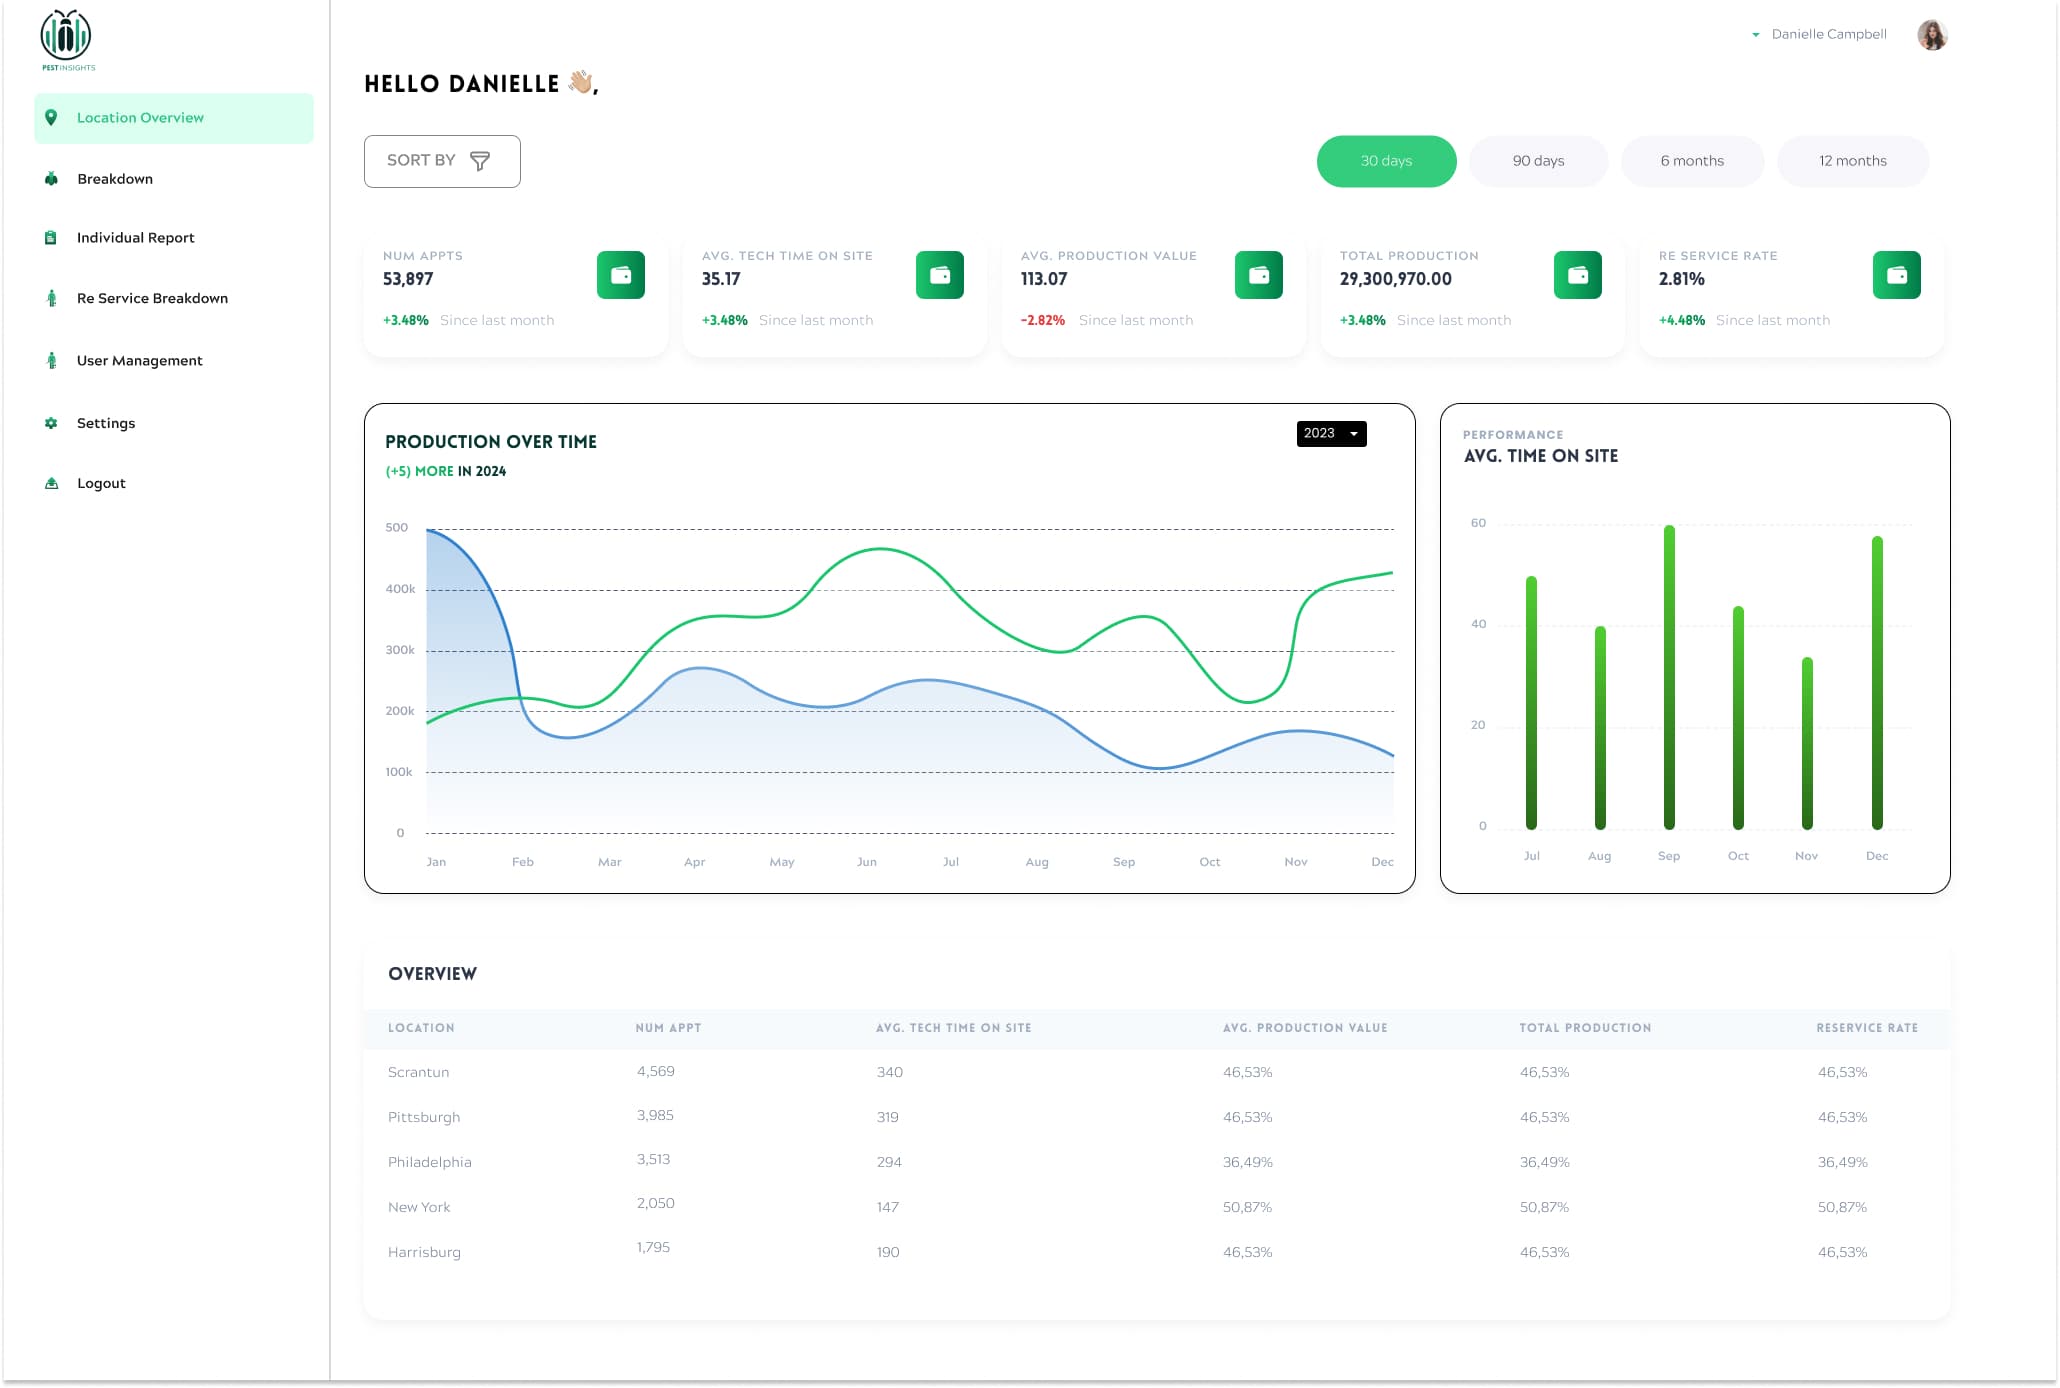
Case study
Pest Insights Dashboard
Location KPIs
views
Sheets
import
MERN
stack
Overview
Operational dashboard for pest-control services with scheduling, routing, and business KPIs.
Problem
Pest-control operators needed location-level KPIs - appointments, tech time on site, production, re-service rate - without rebuilding reports in spreadsheets every month.
Solution
I built Pest Insights as an operational dashboard: React charts and admin flows, Express APIs for company creation and metrics, MongoDB storage, and Google Sheets import so campaign and location data stay in one place.
Architecture & delivery
- React.js dashboard with charts and location tables
- Express.js APIs for companies and KPI endpoints
- MongoDB for profiles and campaign metrics
- Google Sheets API for data import