All projects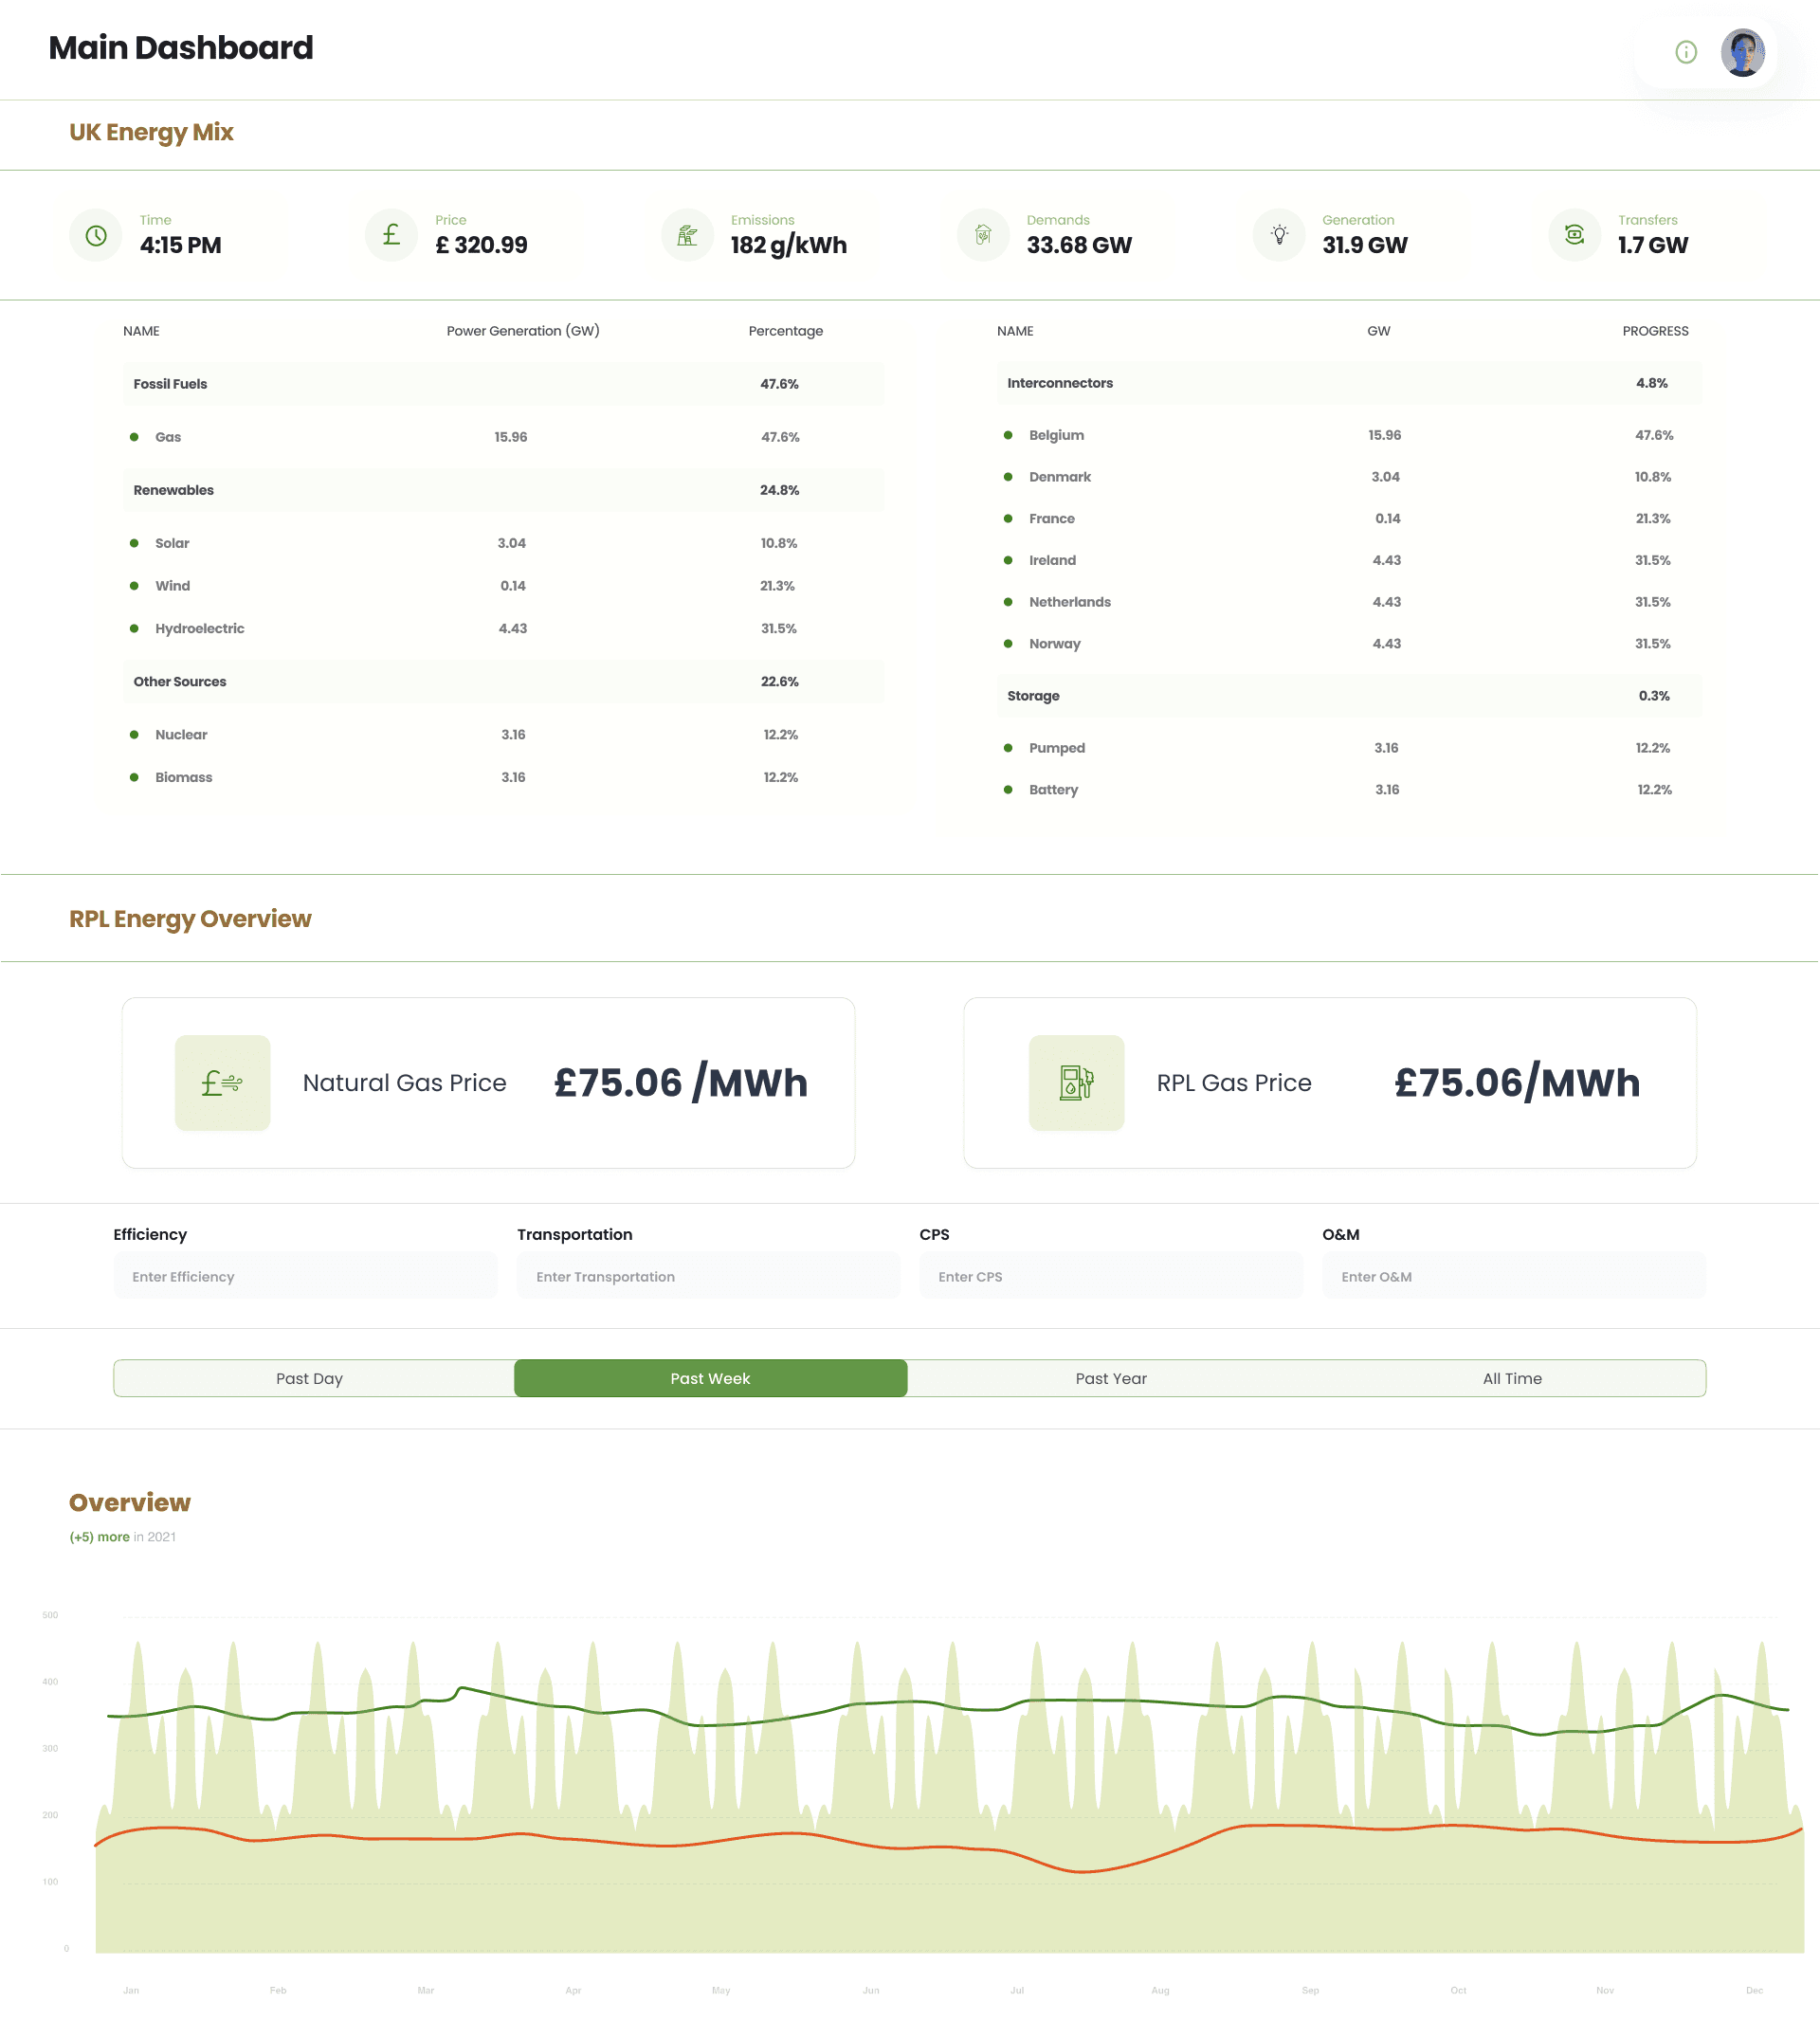
Case study
Solanity Grid - Energy & Gas Dashboard
Energy
domain
Real-time
data
React
stack
Overview
Real-time dashboard for gas, oil, and weather data used in operational monitoring.
Problem
Energy operators needed one operational view of UK energy mix, interconnectors, gas prices, and generation - not scattered spreadsheets and delayed reports.
Solution
I built Solanity Grid as a real-time dashboard for gas, oil, weather, and generation data from REST APIs. React and TypeScript UI with charts, tables, map-ready layouts, and Tailwind CSS for operational monitoring.
Architecture & delivery
- React and TypeScript dashboard with Tailwind CSS
- REST API integration for energy, gas, and weather feeds
- KPI cards, generation tables, and trend charts
- Authenticated portal for operational users